
Introduction
What was the scale of the Stalin’s purges? Basically all publications about the number of repressed divide on two categories. The first category consists from denunciators of the co-called «Totalitarian regime» citing enormously large multimillion numbers of executed and imprisoned. At the same time all these «truth-seekers» stubbornly try to omit the archive data, particularly publicized material which can be found in free access in the internet. Instead of referring to some real archives they either refer to each other or just restrain themselves with phrases like «it is estimated» or «according to the studies» and so on.
However, every conscientious and honest researcher who studies this issue rather quickly finds out that apart from «recollections of eye-witnesses» there is a plethora of documental sources: In the funds of Russian Central State Archive and highest state governing institutes were found a couple of thousands documents referring to the GULAG's activities. It should be noted that GULAG essentially was a Soviet name of the prisons, prisons which every country has in nowadays and always had before, the only difference being that GULAGs had labour activity. For some people it may sound as a discover but every prison has recording and every prisoner has his personal dossier this dossiers are regularly count and all prison documentation always contains full data about its current and former prisoners and their numbers. Consequently in order to determine the real numbers, a researcher should not «estimate» and pluck the numbers out of the air, he should check the documents and collect the archival data.
After examination the archives, such a researcher to his amazement realizes that the scales of repressions about which many people «know» from media and books of some Western propagandists or pseudo-historians are not just beyond the reality, but largely exaggerated. A researcher faces a serious dilemma: professional etiquette tells that obtained material should be published; on the other hand fear of being labeled as a «Stalin’s defender» also prevails. The result of such «tough choice» is usually a «compromised» publication containing a standard bunch of anti-Stalins epithets and the real numbers which are unlike derived out of the thin air numbers confirmed by the reliable archival documents.
The number of repressed
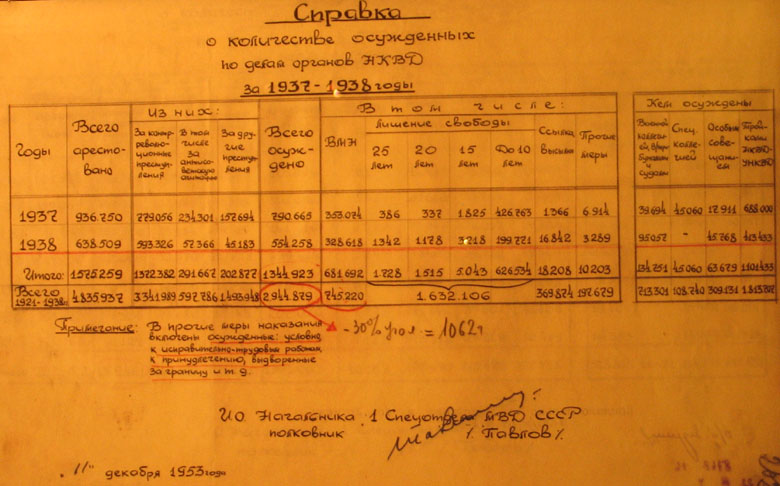
The most famous among the published documents which includes the summary information about repressions is a memorandum addressed to Khrushchev:

1st of February 1954
To the secretary of the Central Committee of the Communist Party of the Soviet Union N.S. Khrushchev
With reference of received information from the members of the Central Committee concerning illegally convicted for counterrevolution activity in past years by Special Council of NKVD, NKVD Troika, Military Collegiums, trial courts and military tribunals, and in accordance with your order to reconsider the dossiers of convicted we report:
Since 1921 until present it was convicted 3.777.380 people. Among them:
The 25 years maximum terms of imprisonment – 2.369.220
Exilement and deportation – 762.180
Death penalty – 642.930
From the total amount of convicted, approximately 2.900.000 people were convicted by Special Council of NKVD, NKDV Troika and 877.000 people by trial courts, military tribunals, special collegiums and military collegiums.
|
The number of prisoners
"Are you sure the information from this memorandum quadrates to facts?", - exclaims skeptically feeling reader who after years of self-brainwash surely ‘’knows’’ about millions of executed and tens of millions sent to the camps. Well, let’s refer to the more detailed statistic. Contrary to the «strugglers with totalitarism» claims, such statistic can be found not only in the archives, but was also published and currently is in free access.
Let’s begin from the number of prisoners in GULAGs. I’d like to remind that all convicted for 3 years and higher usually were in Correctional Labour camps (ITL, Russian: Исправительно Трудовые Лагеря, Ispravitelno Trudovie Lagerya), and convicted for lower than 3 years terms in Correctional Labour Colonies (ITK, Russian: Исправительно Трудовые Колонии, Ispravitelno Trudovie Colonii).
Population in Labour Camps on 1st of January
|
|
|
|

Well, specifically for such dogged freaks, I’d like to show some examples where such numbers were derived from.
NKVD camps, their labour specialization and number of prisoners on the 11th of January 1935
Camp
|
Activity specialization
|
Inmates
|
Dmitrovlag
|
Building of the canal "Moscow-Volga"
|
192.649
|
Bamlag
|
Building of the Trans-Zabaikal and Trans-Ussuriysk railways and Baikal-Amur mainline
|
153.547
|
Belomoro-Baltiyskiy combinat
|
Infrastructure development of Belomor-Baltic canal
|
66.444
|
Siblag
|
Building of Gorno-Shoisk railway; coal mining in Kuzbass; building of Chuisk and Ussuriysk tracks; providing of the labour force to Kuzneck metallurgy facility, Novsibles, etc.
|
61.251
|
Dallag (later Vladivostoklag)
|
Building of "Volochaevka-Komsomolsk" railway; coal mining in the mines "Artyom" and "Raychiha"; building of Sedansk water pipes and oil storage in "Benzostroy"; building works in "Dalpromstroy", "Reserve committe", aviamanufactore №126; fish industry
|
60.417
|
Svirlag
|
Lumber production and storage for Leningrad
|
40.032
|
Sevvostlag
|
Work on "Dalnostroy", and work in Kolyma
|
36.010
|
Temlag
|
Lumber production and storage for Moscow
|
33.048
|
Sredneasiatsk camp (Sazlag)
|
Provision of the labour force to Tekstilstroy, Chirkstroy, Shahrstroy, Hazarbahstroy, state farm ‘’Pahta-Aral’’; cotton farms
|
26.829
|
Karandinsk camp (Karlag)
|
State farms
|
25.109
|
Uhtopechlag
|
Works on Uhto-Pechorinsk: coal mining, oil mining, asphalt producing, radium mining, etc.
|
20.656
|
Provlag (later Astrahanlag)
|
Fish industry
|
10.583
|
Sarovsk camp
|
Timber stockpile and sawmilling
|
3.337
|
Vaigach
|
Zinc, lead and platinum spat mining
|
1.209
|
Ohunlag
|
Road building
|
722
|
On passage to the camps
|
9.756
| |
Total
|
741.599
|
Four years later:
Population in the NKVD camps on the 1st of January 1939
Camp
|
Inmates
|
Bamlag (BAM highway)
|
262.194
|
Sevvostlag (Magadan)
|
138.170
|
Belbaltlag (Karelia)
|
86.567
|
Volgolag (Uglich-Rybinsk)
|
74.576
|
Dallag (Primorskiy Krai)
|
64.249
|
Siblag (Novosibirsk region)
|
46.382
|
Ushosdorlag (Far East)
|
36.948
|
Samarlag (Kuibyshev region)
|
36.761
|
Karlag (Karaganda region)
|
35.072
|
Sazlag (Uzbek SSR)
|
34.240
|
Usolalag (Molotov region)
|
32.714
|
Kargonpollag (Arkhangelsk region)
|
30.069
|
Sevzheldorlag (Komi Republic and Arkhangelsk Oblast.)
|
29.405
|
Yagrinlag (Arkhangelsk region).
|
27.680
|
Vyazemlag (Smolensk region).
|
27.470
|
Uhtimlag (Komi ASSR)
|
27.006
|
Sevurallag (Sverdlovsk region)
|
26.963
|
Lokchimlag (Komi ASSR)
|
26.242
|
Temlag (Mordovia ASSR)
|
22.821
|
Ivdellag (Sverdlovsk region).
|
20.162
|
Vorkutlag (Komi ASSR)
|
17.923
|
Soroklag (Arkhangelsk region)
|
17.458
|
Vyatlag (Kirov region)
|
16.854
|
Oneglag (Arkhangelsk region)
|
16.733
|
Unzhlag (Gorky region)
|
16.469
|
Kraslag (Krasnoyarsk Territory)
|
15.233
|
Taishetlag (Irkutsk region)
|
14.365
|
Ustvymlag (Komi ASSR)
|
11.974
|
Tomasinlag (Novosibirsk region)
|
11.890
|
Gorno-Shor ITL (Altai Territory)
|
11.670
|
Norilsk (Krasnoyarsk Territory)
|
11.560
|
Kuloylag (Arkhangelsk region)
|
10.642
|
Raychihlag (Khabarovsk Territory)
|
8.711
|
Arhbumlag (Arkhangelsk region)
|
7.900
|
Luga camp (Leningrad region)
|
6.174
|
Bukachachlag (Chita region)
|
5.945
|
Prorvlag (Lower Volga)
|
4.877
|
Likovlag (Moscow region)
|
4.556
|
South Harbor (Moscow region)
|
4.376
|
Stalin's station (Moscow region)
|
2.727
|
Mehzavod Dmitrov (Moscow region).
|
2.273
|
Construction № 211 (Ukrainian SSR)
|
1.911
|
Transit prisoners
|
9.283
|
Total
|
1.317.195
|
However as I mentioned before, apart from the ITL camps there were also ITK camps. Before the autumn 1938, ITKs along with the prisons were under the Prison Administration of NKVD. Therefore presented statistic below is shared with prisons:
Population in ITK (Colonies) and Prisons
Year
|
Inmates
|
1935
1936 1937 1938 |
240.259
457.088 375.488 885.203 |
Since 1939 ITK were under GULAG Administration, and prisons under the Main Prison Administration (GTU) NKVD.
Population in ITKs on 1st of January
|
|
|
Population in prisons
Year
|
1st of January
|
January
|
March
|
May
|
July
|
September
|
December
|
1939
1940 1941 1942 1943 1944 1945 1946 1947 1948 |
352.508
186.278 470.693 268.532 237.534 151.296 275.510 245.146 293.135 280.374 |
350.538
190.266 487.739 277.992 235.313 155.213 279.969 261.500 306.163 275.850 |
281.891
195.582 437.492 298.081 237.246 177.657 272.113 278.666 323.492 256.771 |
225.242
196.028 332.936 262.464 248.778 191.309 269.526 268.117 326.369 239.612 |
185.514
217.819 216.223 217.327 196.119 218.245 263.819 253.757 360.878 228.031 |
178.258
401.146 229.217 201.547 170.767 267.885 191.930 259.078 349.035 228.258 |
186.278
434.871 247.404 221.669 171.708 272.486 235.092 290.984 284.642 230.614 |
Now we can compose the table of population in Labour Camps, Colonies and Prisons in the USSR under Stalin by years:
|
|
|
|
From the western researches I’d recommend to read S. Wheatcroft (Australia), J. Getty (US), R. Davis (England), G. Rittersporn (France).
According to the data of A. Kokurin and N. Petrov (both are the members of Memorial organization*), on the first of July 1944 population of camps was 1.2 million inmates, on the 30th of December 1945 - 1.6 millions.
*http://en.wikipedia.org/wiki/Memorial_(society))
And in additional here is the data on population in prisons which were under GULAG administration (the data also collected from Memorial organization):
January1935
January 1937 1.01.1939 1.01.1941 1.01.1945 1.01.1949 1.01.1953 |
307.093
375.376 381.581 434.624 745.171 1.139.874 741.643 |
In addition, I can recommend the fact book which was published by Memorial: The system of labor camps in the USSR, 1923-1960. Moscow, 1998, which confirms the above figures.

So let’s draw the conclusion – during the Stalin’s run the number of inmates have never exceeded 2 million 760 thousands. Not to mention that the highest numbers were during and after the World War when apart from the Soviet citizens the camps consisted also from German, Italian, Finnish, Hungarian, Romanian and other Axis countries POWs and from deserters, traitors, members of Vlasov army etc.
Now let’s compare it with the citadel of democracy and the main fighter for the human rights and freedom the United States of America:
According to the U.S. Bureau of Justice Statistics (BJS) 2,292,133 adults were incarcerated in U.S. federal and state prisons, and county prisons at year-end 2009 — about 1% of adults in the U.S. resident population. Additionally, 4,933,667 adults at year-end 2009 were on probation or on parole. In total, 7,225,800 adults were under correctional supervision (probation, parole, jail, or prison)in 2009 — about 3.1% of adults in the U.S. resident population." In addition, there were 86,927 juveniles in juvenile detention in 2007.


Strange figure isn’t it? The country which volunteered to be the main defender of the human rights and democracy has such amount of inmates in quite peaceful times (comparing to the WW and pre-WW periods). And it should be noted that totalitarian and communistic China who has constantly been accused by US in human rights violation has lower number of inmates: 1.5 millions in China against 2.3 millions in US (not to mention that the population of China is about 1.3 billion and the US population is approx. 300 millions).
And nobody cries on every corner that there are repressions in the USA. Nobody cries that all these 2.3 millions are innocent «victims of the regime», every American will tell you that they all are criminals who deserved to be imprisoned. And of course unlike in the USA, in the Stalin’s USSR all imprisoned were innocent; every democrat knows it for certain. The USSR in fact didn’t have any criminals and the prisons were empty, it was kind of a Disneyland, a land of peaceful hippies with flowers in their hairs and therefore bloody Stalin got bored and decided to fill up the prisons with the innocent citizens, since the criminals were absent.
How many «political» prisoners were among repressed?
It’s quite misleading to assume that the majority of convicted were «victims of political repressions»:
Number of prisoners convicted for counterrevolution activity and other dangerous crimes
Year
|
Death
penalty |
ITL, ITK,
prisons
|
exilement and
deportation
|
other
measures
|
total
|
1921
1922 1923 1924 1925 1926 1927 1928 1929 1930 1931 1932 1933 1934 1935 1936 1937 1938 1939 1940 1941 1942 1943 1944 1945 1946 1947 1948 1949 1950 1951 1952 1953 |
9701
1962 414 2550 2433 990 2363 869 2109 20201 10651 2728 2154 2056 1229 1118 353074 328618 2552 1649 8011 23278 3579 3029 4252 2896 1105
-
- 475 1609 1612 198 |
21724
2656 2336 4151 6851 7547 12267 16211 25853 114443 105683 73946 138903 59451 185846 219418 429311 205509 54666 65727 65000 88809 68887 73610 116681 117943 76581 72552 64509 54466 49142 25824 7894 |
1817
166 2044 5724 6274 8571 11235 15640 24517 58816 63269 36017 54262 5994 33601 23719 1366 16842 3783 2142 1200 7070 4787 649 1647 1498 666 419 10316 5225 3425 773 38 |
2587
1219 - - 437 696 171 1037 3741 14609 1093 29228 44345 11498 46400 30415 6914 3289 2888 2288 1210 5249 1188 821 668 957 458 298 300 475 599 591 273 |
35829
6003 4794 12425 15995 17804 26036 33757 56220 208069 180696 141919 239664 78999 267076 274670 790665 554258 63889 71806 75411 124406 78441 75109 123248 123294 78810 73269 75125 60641 54775 28800 8403 |
Total
|
799455
|
2634397
|
413512
|
215942
|
4060306
|


The expression «other measures» basically implies compulsory treatment or deportation abroad.
From this table can be noticed that the number of «repressed» was higher than it was reported in the Kruscshev’s memorandum – 799.455 sentenced to death penalty instead of 642.980 and 2.634.397 sentenced to imprisonment instead of 2.369.220. However as we can see the gap isn’t that big, the numbers basically in the same scales and we still can’t find any «tens of millions killed» by Stalin.
Besides there is another moment, it is possible that presented table includes a lot of criminals. Because on the second scanned document we can see a rounded number 2.944.879 and a pencil note «among them 30% criminals (1062 thousands) ». In this case the number of «repressed» doesn’t exceed 3 million and the number of executed is also 30% lower than 799.455. But in order to clarify this question in details, further researches should be conducted. Plus each labour camp contained special trials which for prisoners who broke the camp rules, after such a trial in their dossiers it was put a mark that they were convicted for «counterrevolution activity». The thing is that breaking the camp rules was considered as a counterrevolution activity. Therefore among those 3 millions there are also many criminals who have been convicted for murders, robbery and so on.


Let's see now what percentage was «repressed» out of the total inmates of GULAGs:
Percentage of convicts for counterrevolution activity out of the total amount of inmates
|
|
Now let’s proceed to the detailed crimes of GULAG inmates in some years
Population of ITL and alleged crimes of prisoners (On the 1st of April 1940)
Alleged crimes
|
Number
|
%
|
Counterrevolutionary crimes
among them:
Tortskists, Zinovievites, righties
Betrayal of the country Terror Diversion Espionage Sabotage Rulers of the counterrevolution organizations Anti-soviet agitation Other counterrevolution crimes Members of families of traitors Without notes |
417381
17621 1473 12710 5737 16440 25941 4493 178979 133423 13241 7323 |
32,87
1,39 0,12 1,00 0,45 1,29 2,04 0,35 14,10 10,51 1,04 0,58 |
Especially dangerous crimes
among them: Gangsterism and robbery Deserters Other crimes |
46374
29514 13924 2936 |
3,65
2,32 1,10 0,23 |
Other crimes
among them: Vandalism Abroachment Breaking the passport laws Other crimes |
182421
90291 31652 19747 40731 |
14,37
7,11 2,50 1,55 3,21 |
Embezzlement of national wealth
Economic crimes and crimes of officials Crimes against personality Property crimes Socially dangerous elements Military crimes Other crimes Without notes |
23549
96193 66708 152096 220835 11067 41706 11455 |
1,85
7,58 5,25 11,98 17,39 0,87 3,29 0,90 |
Total
|
1269785
|
100,00
|
The number of convicts for counterrevolutionary crimes and banditry, contained in the camps on the first of July 1946
Alleged crimes
|
In the ITL camps
|
%
|
In the ITK camps
|
%
|
Total
|
%
|
Total number of convicted
|
616.731
|
100
|
755.255
|
100
|
1.371.986
|
100
|
Counterrevolutionary crimes,
among them: Betrayal of the country (ст. 58-1) Espionage (58-6) Terrorism Diversion (58-7) Sabotage (58-9) Counterrevolution sabotage (58-14) Membership in the anti-soviet conspiracy groups (58-2, 3, 4, 5, 11) Anti-soviet agitation (58-10) Political crimes (58-2, 5, 9) Illegal crossing the border Smuggling Members of traitors families Socially dangerous elements |
354.568
137.463 12.405 7.391 3.781 2.509 26.411 26.099 85.652 5.937 2.655 3.722 1.012 6.382 |
57,5
22,3 2,0 1,2 0,6 0,4 4,3 4,2 13,9 1,0 0,4 0,6 0,1 1,9 |
162.024
66.144 3.094 2.038 770 610 4.533 10.833 56.396 2.835 1.080 259 457 1.323 |
21,4
8,7 0,4 0,3 0,1 0,1 0,6 1,4 7,5 0,4 0,1
-
0,1
0,2 |
516.592
203.607 15.499 9.429 4.551 3.119 30.944 36.932 142.048 8.772 3.735 4.031 1.469 7.705 |
37,6
14,8 1,1 0,7 0,3 0,2 2,3 2,7 10,4 0,6 0,3 0,3 0,1 0,6 |
Crimes
|
Total
|
In the ITL camps
|
In the ITK camps
|
Counterrevolutionary crimes
Betrayal of the country (art.58-1а, б)
Espionage (art.58-1а, б, 6; art.193-24) Terrorism (art.58-8) Terroristic intentions Diversion (art.58-9) Sabotage (art.58-7) Counterrevolution sabotage (apart from those who refused to work in camps and for escape) (art. 58-14) Counterrevolution sabotage (for refusal of working in the camps) (art.58-14) Counterrevolution sabotage (for escapes)
(art.58-14)
Membership in the anti-soviet conspiracy groups (art.58, пп. 2, 3, 4, 5, 11) Anti-soviet agitation (art.58-10, 59-7) Insurgency, political thuggery (art.58, п.2; 59, пп.2, 3, 3б) Members of traitors families (art. 58-1в) Socially dangerous elements Other crimes Total | 334538 18337 7515 2329 3250 1165 4494 10160 22687 46582 99401 12947 3256 2846 10371 579918 | 285288 17786 7099 2135 3185 1074 3523 8724 19708 39266 61670 12515 2824 2756 8423 475976 | 49250 591 416 194 65 91 971 1436 2979 7316 37731 432 432 90 1948 103942 |
Felonies
Embezzlement of national wealth (Decree dated August 7, 1932)
By decree of June 4, 1947 "On strengthening the protection of personal property of citizens " By decree of June 4, 1947 "Criminal Law for the theft of state and public property " Speculation Banditry and armed robbery (Article 59-3, 167), not committed in places of detention Banditry and armed robbery (Article 59-3, 167), committed while serving a sentence Premeditated murder (Article 136, 137, 138) committed not in custody Premeditated murder (Article 136, 137, 138) committed in prison Illegally crossing the border (Article 59, 10, 84) Smuggling activities (Article 59, 9, 83) Abaction (Art.166) Thieves recidivists (Art.162-in) Property crimes (Art.162-178) Vandalism (Article 74 and Decree of 10 August 1940) Violation of the certification (Art.192) For escape from the places of detention, exile and deportation (Art.82) For unauthorized exit (escape) from the binding sites settlements (Decree of 26 November 1948) Evicted for harboring fleeing from places compulsory settlement, or aiding and abetting Socially dangerous elements Desertion (Article 193-7) Maiming (Article 193-12) Looting (Article 193-27) Other military crimes (Article 193, except pp.7, 12, 17, 24, 27) Illegal possession of firearms (Art.182) Officials and economic crimes (Article 59-3b, 109-121, 193 pp.17, 18) By decree of June 26, 1940 (voluntary departure with enterprises and institutions and of absenteeism) By decree of the Presidium of the Supreme Soviet of the USSR (Other than those listed above) Other crimes
Total
|
72293
394241 637055 73205 65816 12047 37808 3635 1920 368 15112 6911 61194 93477 40599 22074 3328 1021 416 39129 2131 512 19648 12932 128618
26485
35518 140665 1948228 |
42342
242688 371390 31916 53522 11026 22950 3041
1089
207 8438 3883 35464 32718
7484
12969
1504 989
343
29457 1527
429
13033
6221
47630
881
11921 62729 1057791 |
29951
151553 265665 41289 12294 1021 14858 594
901
161 6674 3028 25730 60759
33115
9105
1824 32
73
9672 604
83
6615
6711
80988
25604
23597 77936 890437 |
Total:
|
2528146
|
1533767
|
994379
|
Thus as we can see the number of «repressed» among prisoners was lower than 30%. Exception is 1944-1948 period when camps got an appending of vlasovtsy, polizai and other «strugglers with the communistic tyranny».
Mortality rate
The archive data allows answering this question.
Mortality rate of ITL camps
Year
|
Number of prisoners
|
Died
|
%
|
1931
1932 1933 1934 1935 1936 1937 1938 1939 1940 1941 1942 1943 1944 1945 1946 1947 1949 1950 1951 1952 |
240.350
301.500 422.304 617.895 782.445 830.144 908.624 1.156.781 1.330.802 1.422.466 1.458.060 1.199.785 823.784 689.550 658.202 704.868 958.448 1.316.331 1.475.034 1.622.485 1.719.586 |
7283
13267 67297 26295 28328 20595 25376 90546 50502 46665 100997 248877 166967 60948 43848 18154 35668 15739 14703 15587 13806 |
3,03
4,40 15,94 4,26 3,62 2,48 2,79 7,83 3,79 3,28 6,93 20,74 20,27 8,84 6,66 2,58 3,72 1,20 1,00 0,96 0,80 |
Unfortunately I didn’t find the data for 1948 year.
Mortality rate of prisons
Year
|
Number of prisoners
|
Died
|
%
|
1939
1940 1941 1942 1943 1944 1945 1946 1947 1948 1949 1950 1951 |
269.393
328.486 369.613 253.033 194.415 213.403 260.328 269.141 286.755 255.711 214.896 181.712 158.647 |
7036
3277 7468 29788 20792 8252 6834 2271 4142 1442 982 668 424 |
2,61
1,00 2,02 11,77 10,69 3,87 2,63 0,84 1,44 0,56 0,46 0,37 0,27 |
The number of prisoners took as arithmetic middling among the numbers of prisoners between 1st of January and 31st of December.
Mortality on the eve of the war was lower than in the ITK camps. For instance in 1939 it was 2,30%.
Mortality rate of ITK
Year
|
Number of prisoners
|
Died
|
%
|
1949
1950 1951 1952 |
1.142.688
1.069.715 893.846 766.933 |
13966
9983 8079 7045 |
1,22
0,93 0,90 0,92 |
Thus the facts show that contrary to denunciators beliefs, mortality rate under Stalin was maintained on the low level. However we can see the drastic difference during the 1941-1945 period and obviously the conditions of prisoners were worse than before. Nutrition standards were diminished and that caused immediate increasing of lethal cases. By the end of 1944 nutrition standards were a little bit improved: in bread – on 12%, in grits – on 24%, in meat and fish on – 40%, in fats – 28% and in vegetables – on 22%, and the mortality subsequently started to downgrade. But even after that nutrition standards were lower than before the war on 30%.
Nevertheless even during the hardest years of war 1942 – 1943 mortality rate was about 20%, in prisons – 10% per year. Not 10% - 20% per month like Alexander Solzhenitsyn or other bunch of «historians» claimed. Up to the beginning of 50s, mortality rate downgraded to less than 1% and in prisons – less than 0.5%.
In conclusion I’d like to say about so-called Special Camps (Osoblags) which were established under the order of Ministry Council of the USSR №416-159 on 21st of February 1948. These camps contained spies, terrorists, saboteurs, trotskists, righties, mensheviks, esers, anarchists, nationalists, white movements, members of anti-soviet organizations and socially dangerous elements.
Population in special camps on January 1952
№
|
Name of the camp
|
spies
|
saboteurs
|
terrorists
|
trotskists
|
righties
|
mensheviks
|
esers
|
anarchists
|
nationalists
|
white movements
|
members of the anti-soviet organizations
|
socially dangerous elements
|
Total
|
1
|
Mineralniy
|
4012
|
284
|
1020
|
347
|
7
|
36
|
63
|
23
|
11688
|
46
|
4398
|
8367
|
30292
|
2
|
Gorniy
|
1884
|
237
|
606
|
84
|
6
|
5
|
4
|
1
|
9546
|
24
|
2542
|
5279
|
20218
|
3
|
Dubravniy
|
1088
|
397
|
699
|
278
|
5
|
51
|
70
|
16
|
7068
|
223
|
4708
|
9632
|
24235
|
4
|
Stepnoy
|
1460
|
229
|
714
|
62
|
-
|
16
|
4
|
3
|
10682
|
42
|
3067
|
6209
|
22488
|
5
|
Berogovoy
|
2954
|
559
|
1266
|
109
|
6
|
-
|
5
|
-
|
13574
|
11
|
3142
|
10363
|
31989
|
6
|
Rechnoy
|
2539
|
480
|
1429
|
164
|
-
|
2
|
2
|
8
|
14683
|
43
|
2292
|
13617
|
35459
|
7
|
Ozyorniy
|
2350
|
671
|
1527
|
198
|
12
|
6
|
2
|
8
|
7625
|
379
|
5105
|
14441
|
32342
|
8
|
Peschaniy
|
2008
|
688
|
1203
|
211
|
4
|
23
|
20
|
9
|
13987
|
116
|
8014
|
12571
|
38854
|
9
|
Lugovoy
|
174
|
118
|
471
|
57
|
1
|
1
|
2
|
1
|
3973
|
5
|
558
|
2890
|
8251
|
Mineralniy
|
18475
|
3663
|
8935
|
1510
|
41
|
140
|
190
|
69
|
93026
|
884
|
33826
|
83369
|
244128
|
Mortality rate can be derived from the table below:
Statistic of the special camps on the 1st of January 1951
№
|
Name of the camp
|
For CR crimes
|
Felonies
|
Total
|
Died
|
Freed
|
1
|
Mineralniy
|
30235
|
2678
|
32913
|
91
|
479
|
2
|
Gorniy
|
15072
|
10
|
15082
|
26
|
1
|
3
|
Dubravniy
| |||||
4
|
Stepnoy
|
18056
|
516
|
18572
|
124
|
131
|
5
|
Berogovoy
|
24676
|
194
|
24870
|
нет
|
нет
|
6
|
Rechnoy
|
15653
|
301
|
15954
|
25
|
нет
|
7
|
Ozyorniy
|
27432
|
2961
|
30393
|
162
|
206
|
8
|
Peschaniy
|
20988
|
182
|
21170
|
24
|
21
|
9
|
Lugovoy
|
9611
|
429
|
10040
|
35
|
15
|
Contrary to popular beliefs that special camps were «death camps» for dissidents, we can see that in fact the mortality rate there was approx. 0,29% - 1,15%.
Epilogue
Following Stalin’s death, Khruscshev gave an order to re-consider the dossiers of «repressed». Many of them were freed. Consequently if Stalin imprisoned tens of millions like ‘’the greatest historians’’ claim the number of freed people would be also counted in millions. However the documents say different:


Since 1954 until 1956 year, 337.183 dossiers have been reconsidered. Out of them 153.502 people have been freed, and 183.681 remained in the prisons probably because they were too much innocent to be freed. I wonder where the millions of liberated are. Possibly they built a spacecraft during their living in GULAG and flew on Moon. If so, does that mean we have strong evidence that Americans were not the first who have conducted flight on Moon?
References:
1. Alexander Dugin. Stalinism: Legends and Facts / / Word. 1990, № 7. P.24.
2. Victor Zemskov. Gulag (historical-sociological aspect) / / Case Studies. 1991, № 6. P.15.
3. Victor Zemskov. Inmates in the 1930s: social and demographic issues / / National History. 1997, № 4. P.67.
4. Alexander Dugin. Stalinism: Legends and Facts / / Word. 1990, № 7. P.23; archival source: 1930-1934. - GARF, f.9414, op.1, d.1155, F. 1, 1935-1940. - Ibid, L.2.
5. GARF, f.5446, op.11, d.1310, l.13-14.
6. GARF, f.9414, op.1, d.1155, l.20-22.
7. Alexander Dugin. Stalinism: Legends and Facts / / Word. 1990, № 7. P.23.
8. Victor Zemskov. Gulag (historical-sociological aspect) / / Case Studies. 1991, № 6. C.11.
9. The evacuation of prisoners from the prison of the NKVD of the USSR in 1941-1942 / / Military-Historical Archive. 1997, issue 2. S.234.
10. Gulag during World War II / / Military-Historical Journal. 1991. № 1. P.19, P.23.
11. Nekrasov, VF Thirteen "iron" of People's Commissars. M.: "Milestones," 1995. P.172, P 234, P. 241
12. A. Kokurin, Petrov. NKVD-KGB, SMERSH-: structure, functions, and personnel. Article Four (1944-1945) / / Free Thought.1997, № 9. P.95, 96.
13. A. Kokurin, Petrov. MIA: structure, functions, and personnel. Article Sixth (1946-1953) / / Free Thought. 1997, № 12.P.103.
14. Population of the world / ed. B.Ts. Urlanis. MA: "Statistics", 1974. P.23.
15. Alexander Dugin. Stalinism: Legends and Facts / / Word. 1990, № 7. C.26.
16. GARF, f.9401, op.1, d.4157, l.201-205, VP Popov. State terror in Soviet Russia. 1923-1953 gg.: Sources and interpretations / / Domestic archives. 1992, № 2. P.28.
17. V.P. Popov. State terror in Soviet Russia. 1923-1953 gg.: Sources and interpretations / / Domestic archives. 1992, № 2.P.29.
18. Alexander Dugin. Stalinism: Legends and Facts / / Word. 1990, № 7. P.23, 1934-1939. - GARF, f.9414, op.1, d.1155, l.3-6.
19. GARF, f.9414, op.1, d.1155, l.26-27.
20. Alexander Dugin. Stalinism: Legends and Facts / / Word. 1990, № 7. P.25.
21. Victor Zemskov. Gulag (historical-sociological aspect) / / Case Studies. 1991, № 7. P.10-11.
22. Victor Zemskov. Gulag (historical-sociological aspect) / / Case Studies. 1991, № 6. P.14-15, 1931-1940. - GARF, f.9414, op.1, d.1155, L.2, d.2740, F. 1, 5, 8, 14, 26, 38, 42, 48, 58, 96-110, 1949-1952 gg. - AN Dugin Unknown Gulag: The documents and facts. Moscow: Nauka, 1999. P.41, 43, 45, 49.
23. Victor Zemskov. Gulag (historical-sociological aspect) / / Case Studies. 1991, № 7. C.7, AN Dugin Unknown Gulag: The documents and facts. Moscow: Nauka, 1999. P.31.
24. GARF, f.9414, op.1, 28, l.13.
25. Alexander Dugin Unknown Gulag: The documents and facts. Moscow: Nauka, 1999. P.41, 43, 45, 49.
26. Victor Zemskov. Gulag (historical-sociological aspect) / / Case Studies. 1991, № 6. P.21-22.
27. The system of labor camps in the USSR, 1923-1960: A Handbook. M., 1998. P.52.
28. Alexander Dugin Unknown Gulag: The documents and facts. Moscow: Nauka, 1999. P.43, 47.
No comments:
Post a Comment